Linear Function
A linear function has the form . Its graph is a straight line.
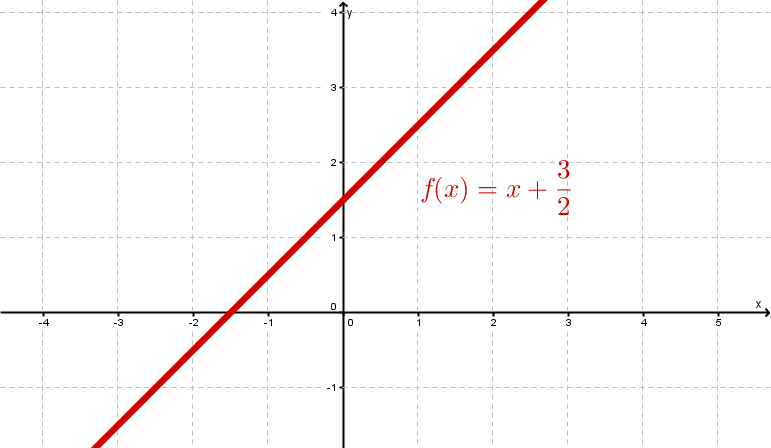
For example, the graph of a linear function looks like this:
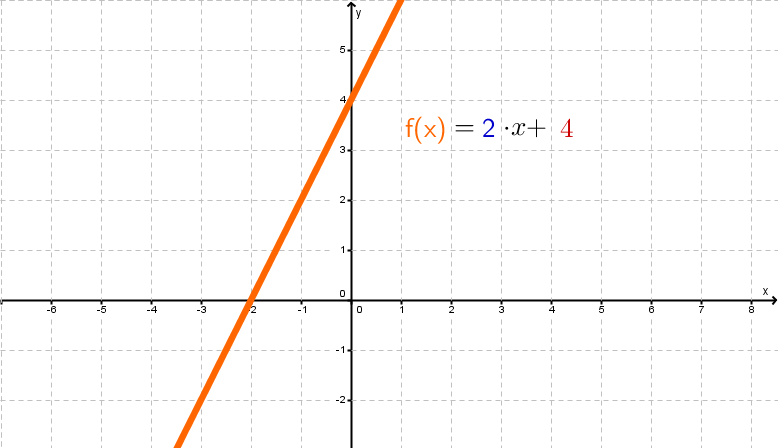
The slope
The number in front of the variable indicates the slope of the function.
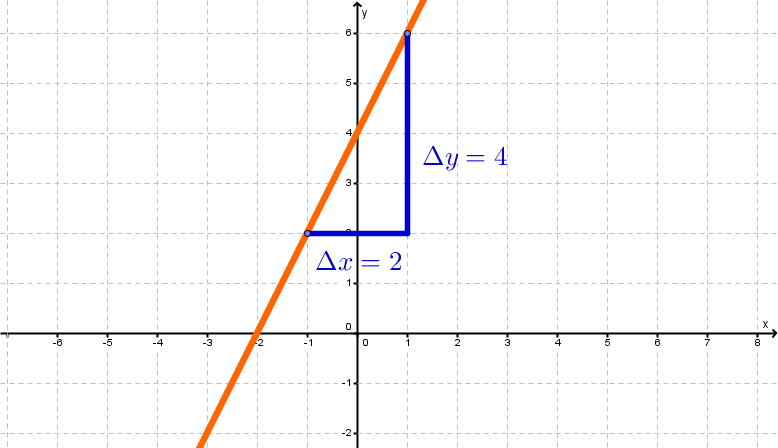
The slope can be read from the graph using the gradient triangle:
In the example the slope is
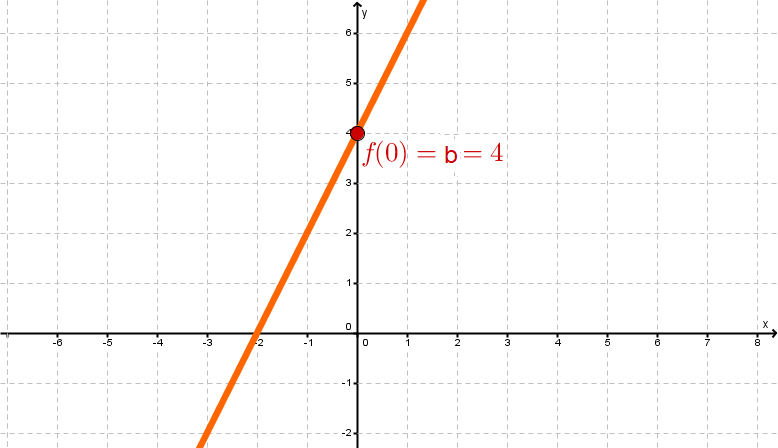
The -axis intercept
The number indicates the -axis intercept of the function. The -axis intercept is the function value at .
Often an or a is used instead of the .
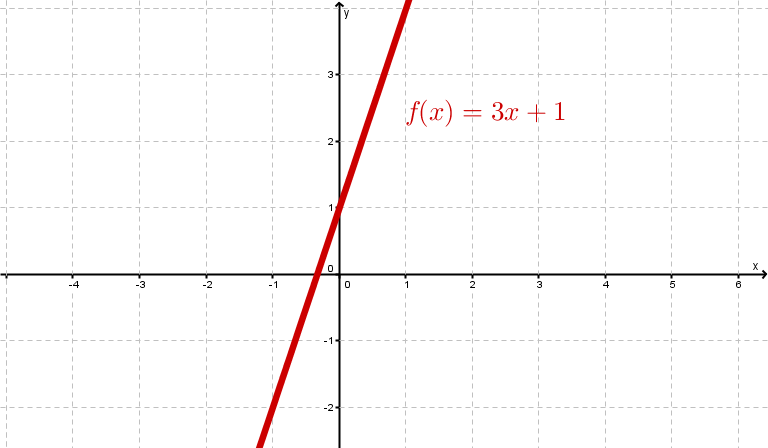
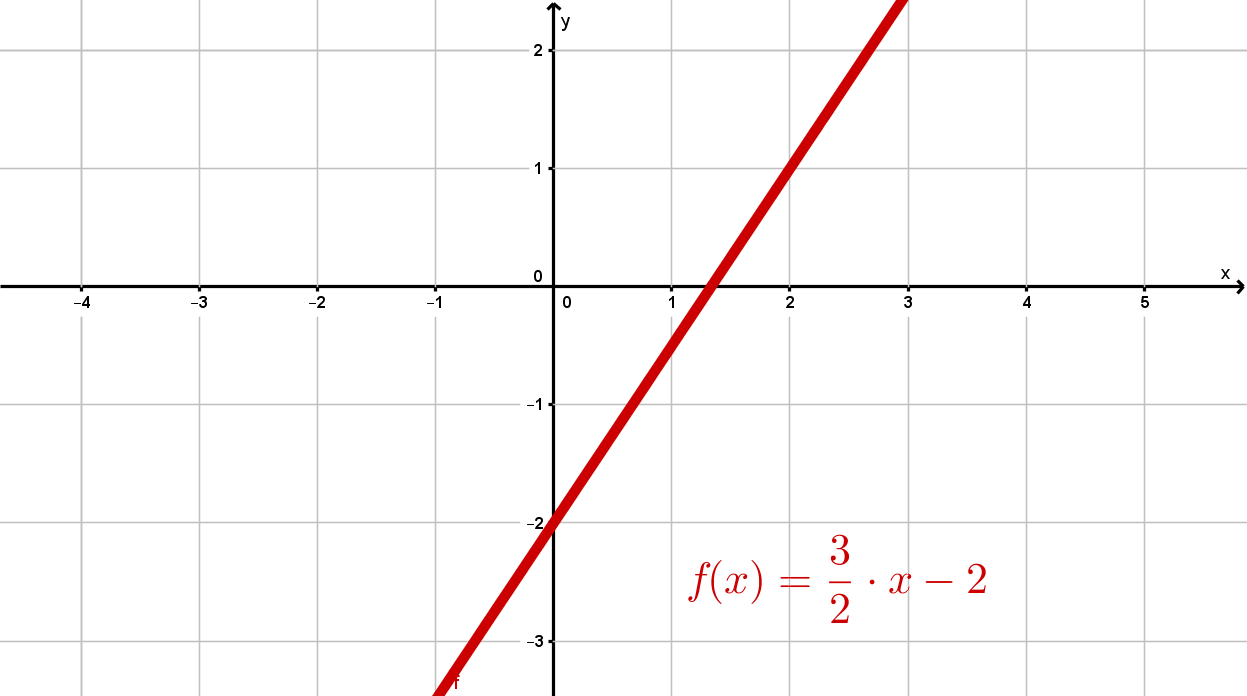
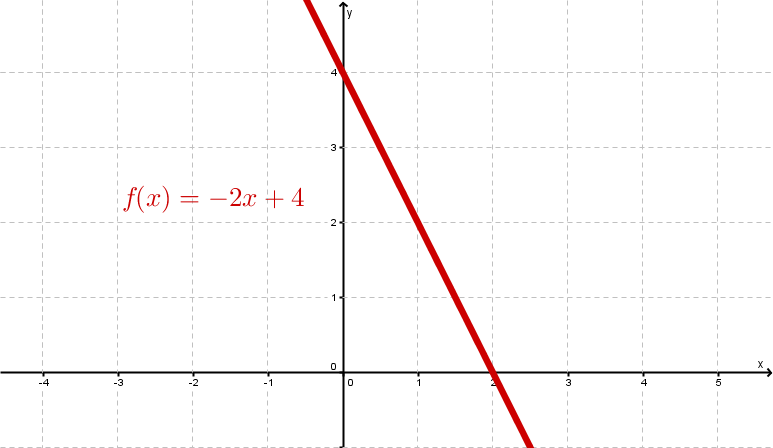
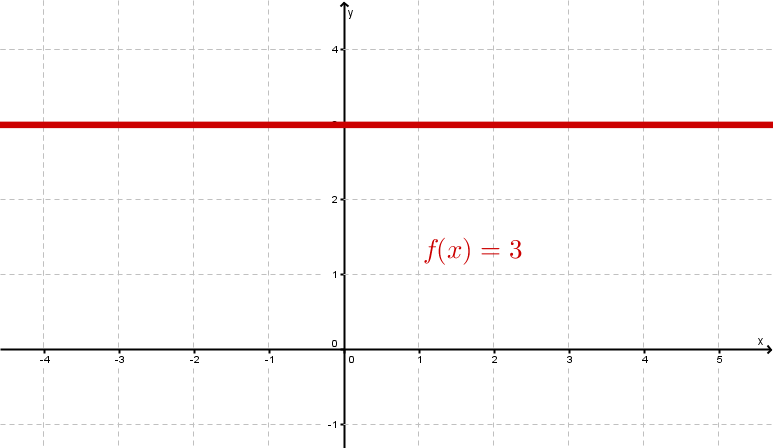
Examples
Video on the topic "Linear functions"
Loading
This video explains what is meant by a linear function.
For each -value you get exactly one -value.
The highest exponent of is .
Example:
The terms function equation and function graph are explained.
This video was created by Sebastian Schmidt for his lessons according to the Flipped Classroom concept and was published on his channel on YouTube.
It continues with function equations and zeros of linear functions. This work is available under the free licence CC BY-SA 4.0.Information.