Draw the graph corresponding to the given table of values.
𝐱
−8
−4
0
4
8
𝐲
1
2
3
For this task you need the following basic knowledge: Lines in coordinate systems
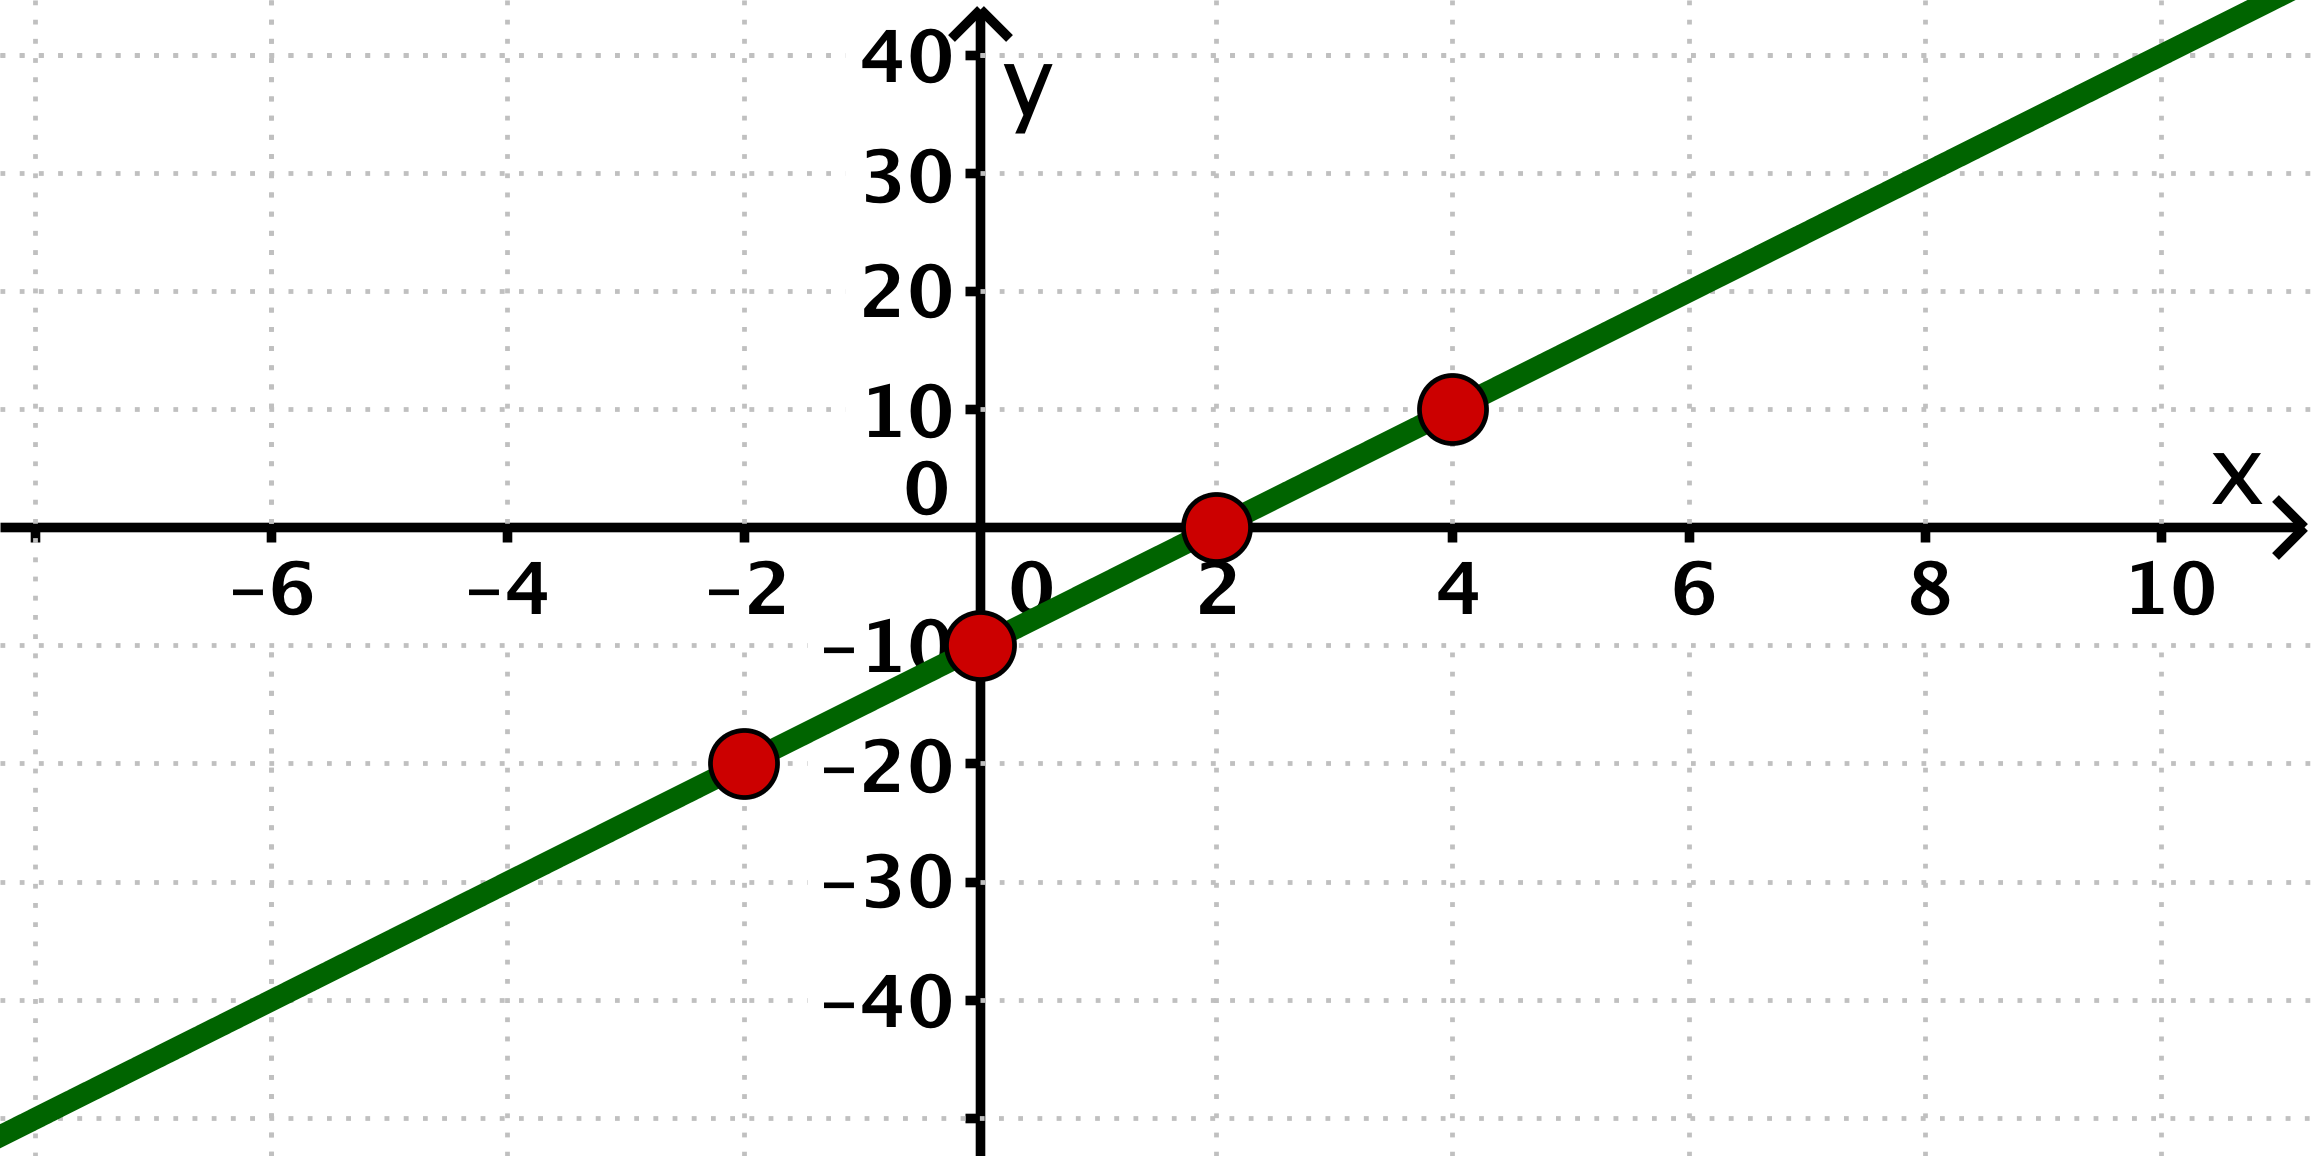
Draw the five given points in a coordinate system and draw a straight line through the points.
−2
−20
−10
10
Draw the four given points in a coordinate system and draw a straight line through the points.