A car has a fuel supply of 56 liters of gasoline. It consumes 7.5 liters per 100 km.
Create a table for the consumption in liters for distances between 0km and 600km (with 100km between two values).
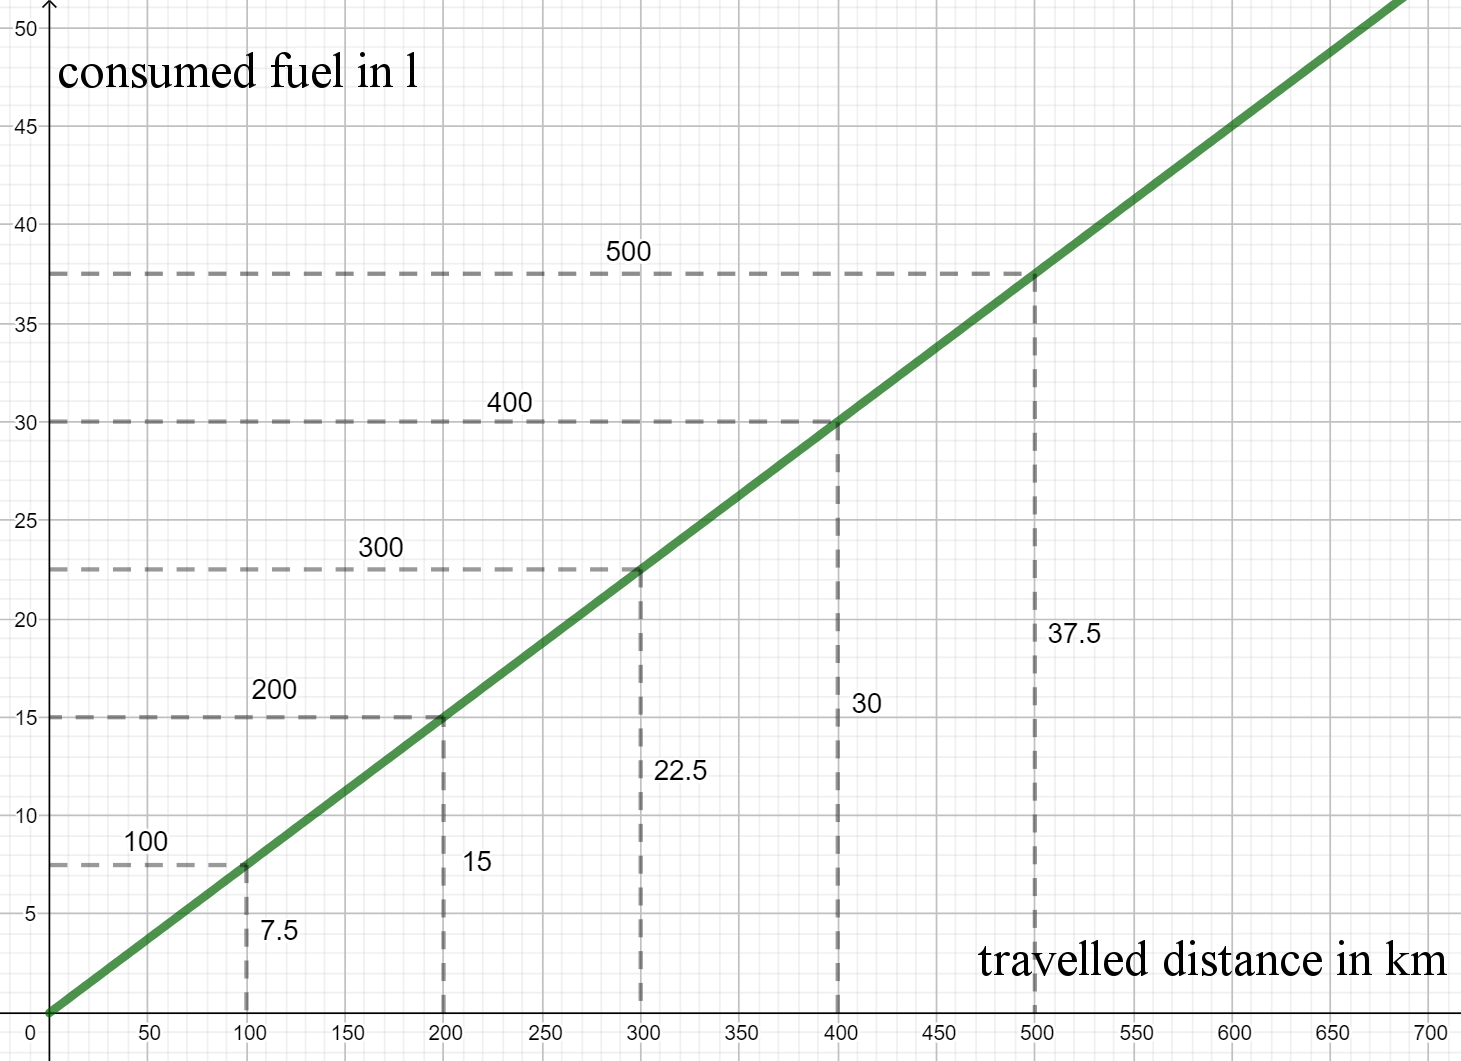
distance traveled
0 km
100 km
200 km
300 km
400 km
500 km
600 km
fuel consumption
0 l
7.5 l
15 l
22.5 l
30 l
37.5 l
45 l
Visualize the relation graphically.
For this task you need the following basic knowledge: Linear function
You can draw the function in your coordinate system by entering the points from the table in part a) and then connecting them by a line.
After how many km would the car run out of gasoline? In order to not run out of gasoline, one should refuel it if the supply has reached a level of 5L. After how many km will this point be reached?
For this task you need the following basic knowledge: Linear function
First, you should represent the gasoline consumption by a linear function. It has the form where stands for the travelled distance and f(x) for the consumed gasoline. You can now determine the values of and by substituting two points from the table of values.
The following linear function yields the gasoline consumption for a given number of travelled kilometers:
When is the fuel supply empty?
The tank holds 56 liters of gasoline. You may now insert this value as and calculate the associated -value:
So the fuel will run out after about 746 km.
When should the car be refueled?
The car should be refueled, when there are 5 liters of gasoline in the tank. Since at the beginning, the tank holds 56 liters, the car will cosume exactly 51 liters until this point. You can insert this into the function just as above: