Exercises: Drawing graphs of linear functions
- 1
Draw the graph corresponding to the given table of values.
For this task you need the following basic knowledge: Lines in coordinate systems
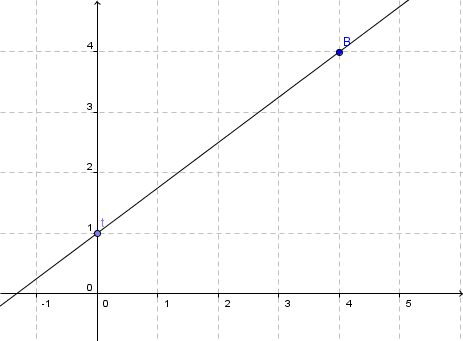
Draw the five given points in a coordinate system and draw a straight line through the points.
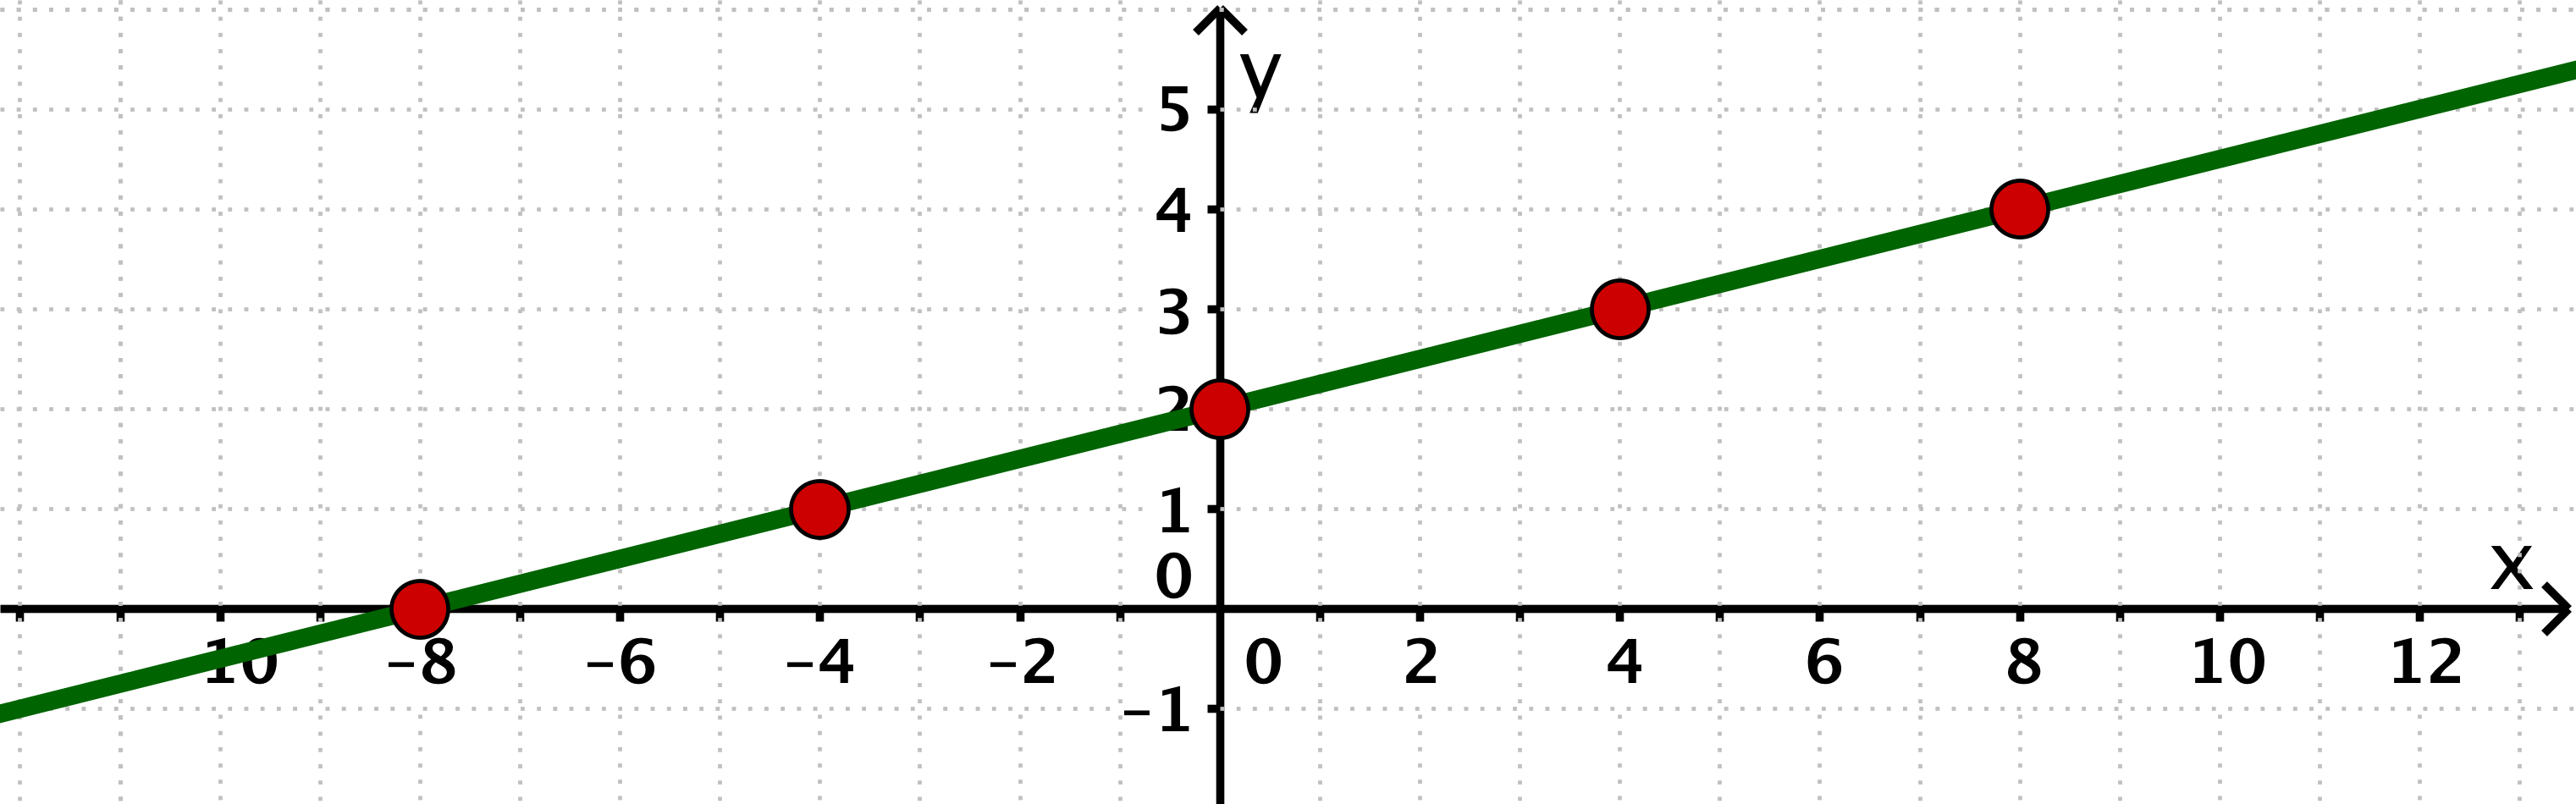
For this task you need the following basic knowledge: Lines in coordinate systems
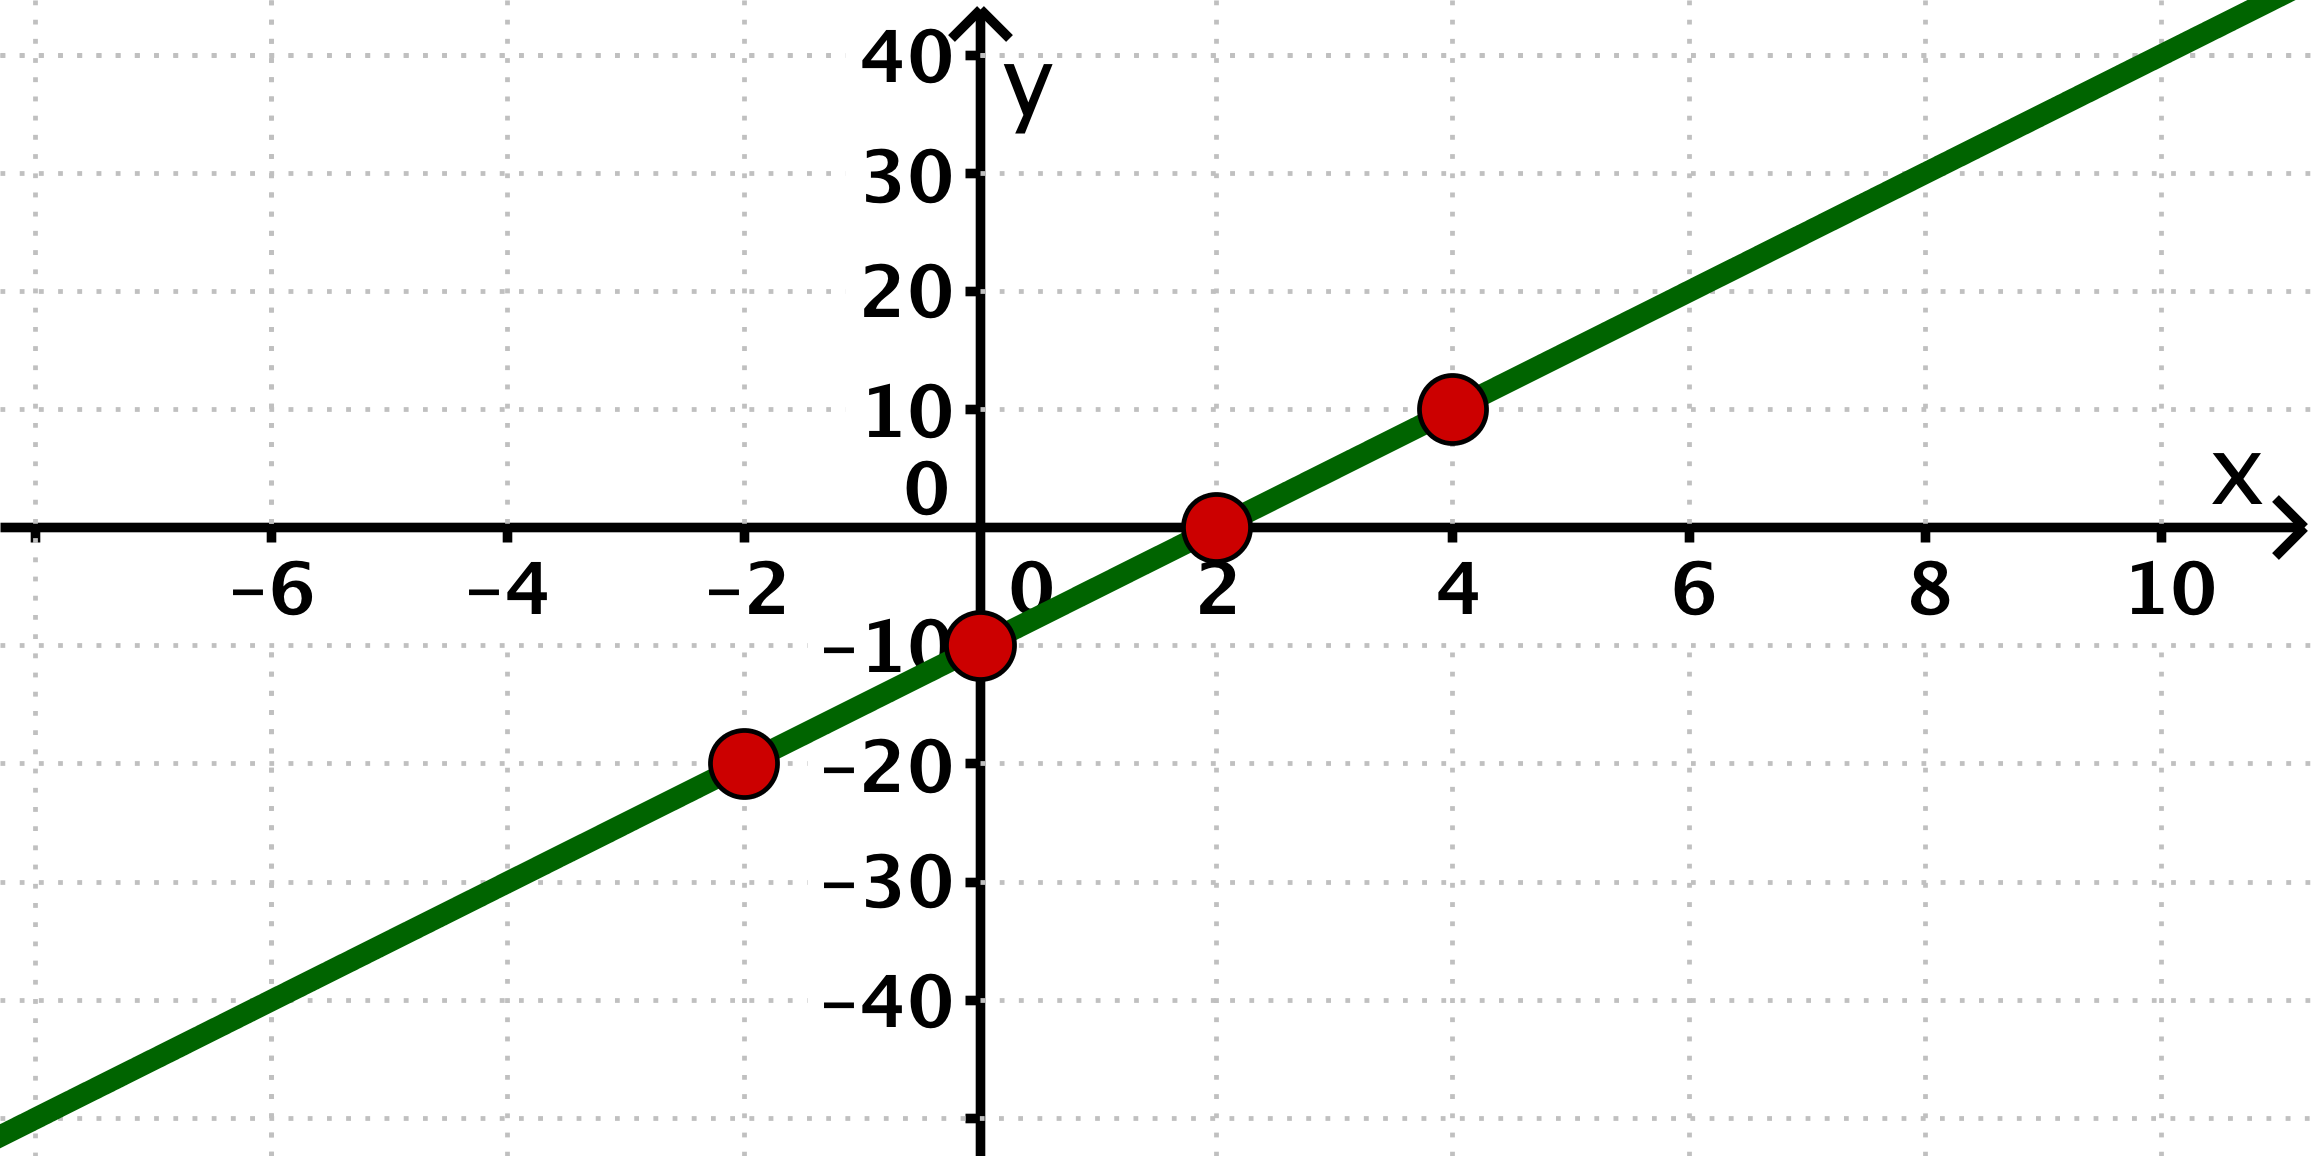
Draw the four given points in a coordinate system and draw a straight line through the points.
- 2
Draw the graph of the linear functions in a coordinate system!
For this task you need the following basic knowledge: Slope/Gradient of a line
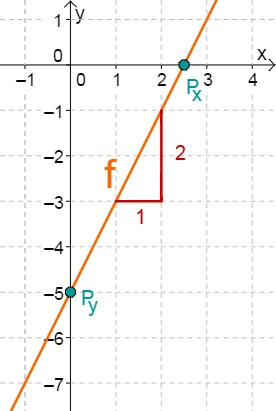
Drawing the linear function
First read off the -intercept and the slope from the function term of the linear function.
In this case:
You obtain a -intercept of and a slope of .
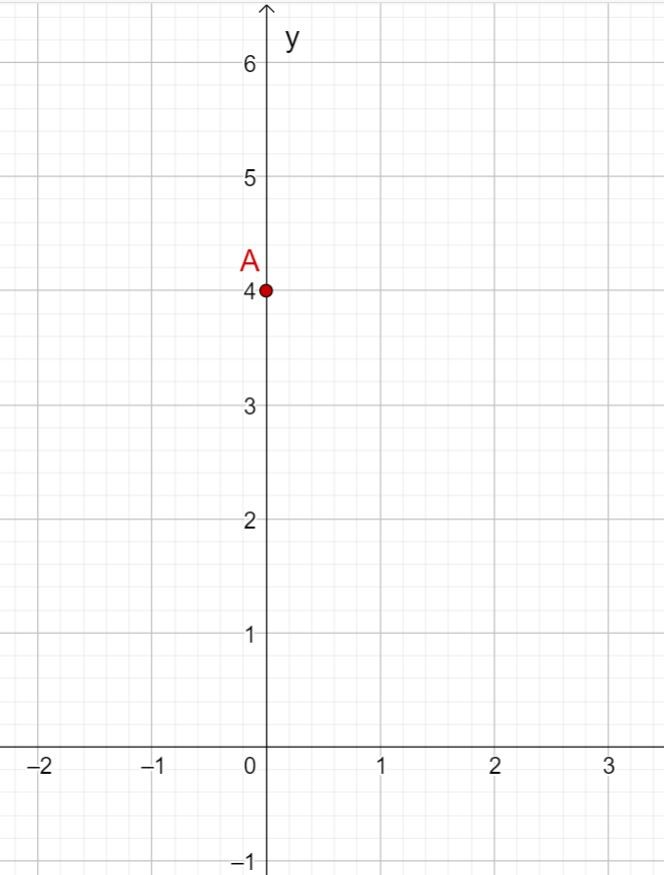
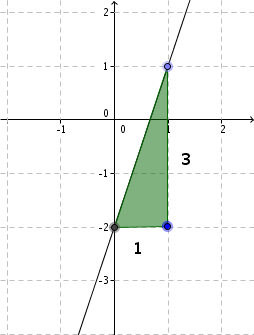
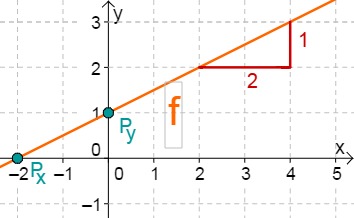
First draw the intersection with the -axis that results from the -axis intercept. This is at .
Then draw a gradient triangle using the gradient. To do this, go one length unit to the right and two length units down. This gives you the point . Now draw the straight line through points and .
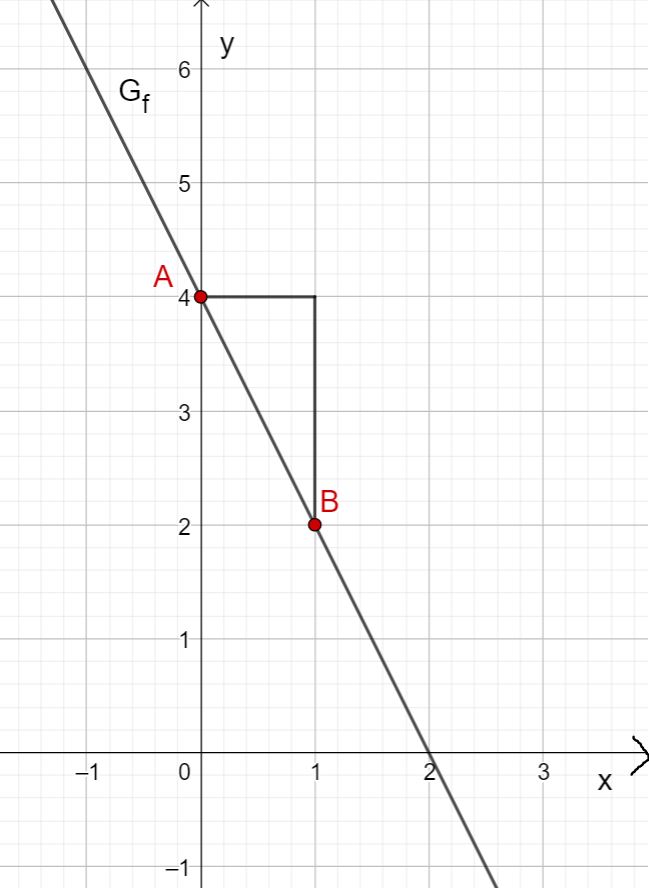
You obtain the graph of .
For this task you need the following basic knowledge: Slope/Gradient of a line
Drawing the linear function
First read off the -intercept and the slope from the function term of the linear function.
In this case:
You obtain a -intercept of and a slope of .
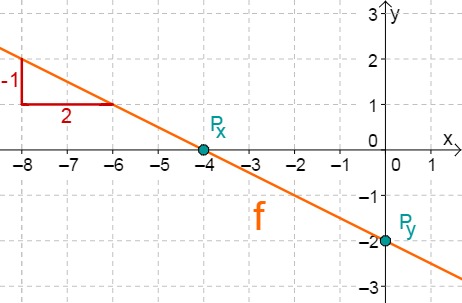
First draw the intersection with the -axis that results from the -axis intercept. This is at .
Then draw a gradient triangle using the gradient. To do this, go one length unit to the right and two length units down. This gives you the point . Now draw the straight line through points and .
You obtain the graph of .
For this task you need the following basic knowledge: Slope/Gradient of a line
Drawing the linear function
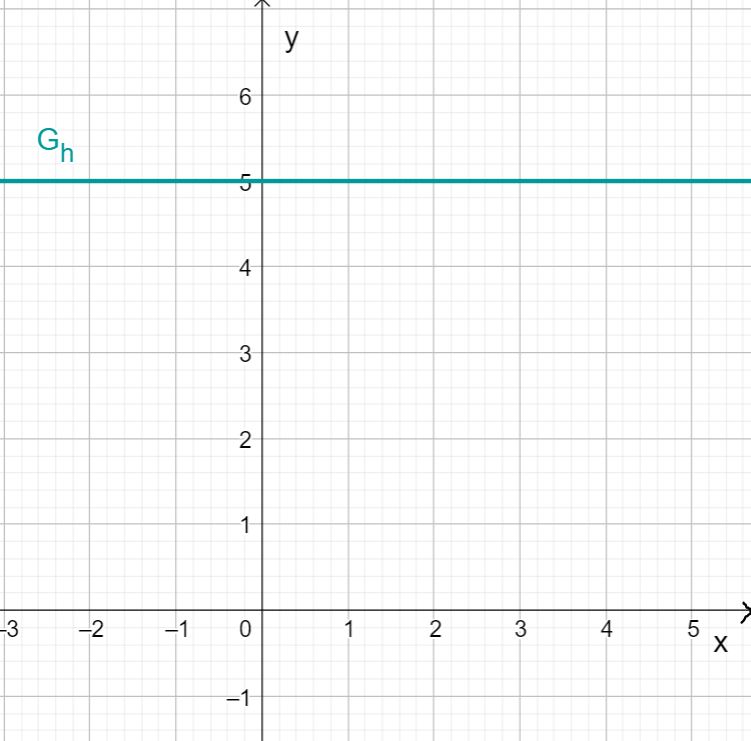
The function represents a special case of a linear function. The slope of is .
This means that the function value does not change regardless of the variable .
So if you draw the function value for each in a coordinate system, you get a straight line that runs parallel to the axis at the height .
- 3
Draw the graphs of the functions with the following equation:
For this task you need the following basic knowledge: Linear function
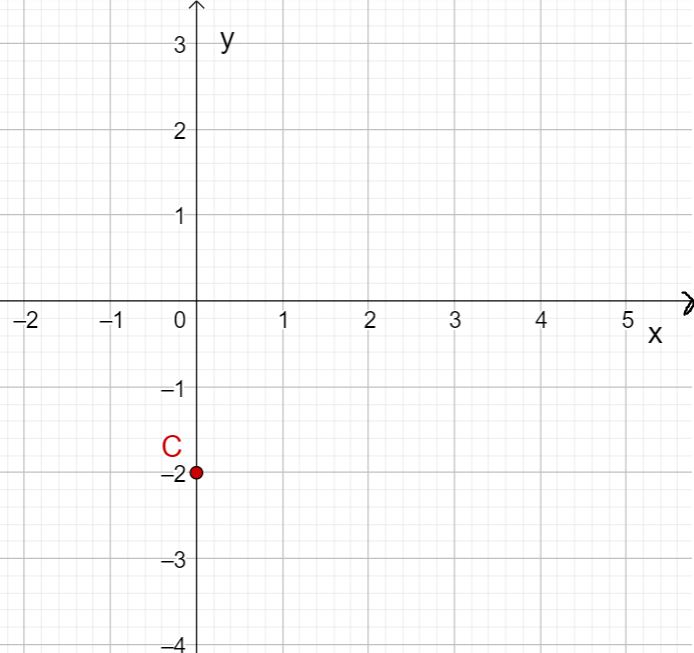
Determine one point
is the within the general line equation, or in other words, the -axis intercept.
Find the slope
Determine the slope of the function
is the within the general line equation, or in other words, the slope.
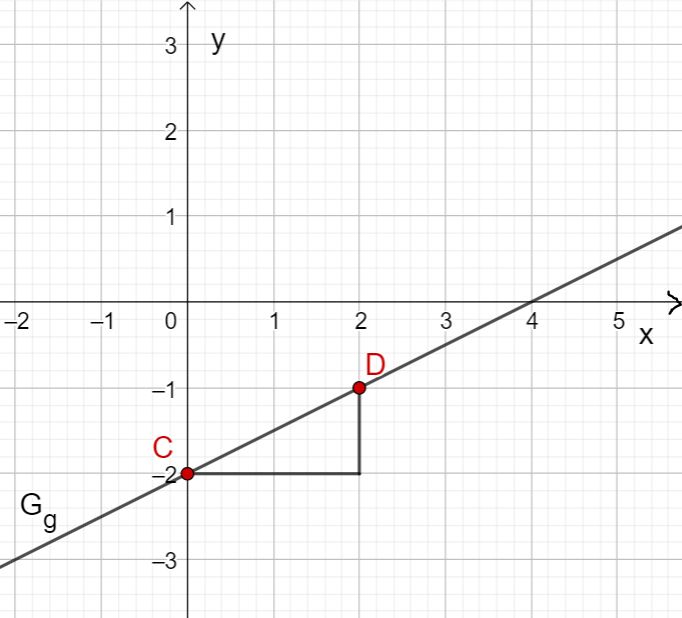
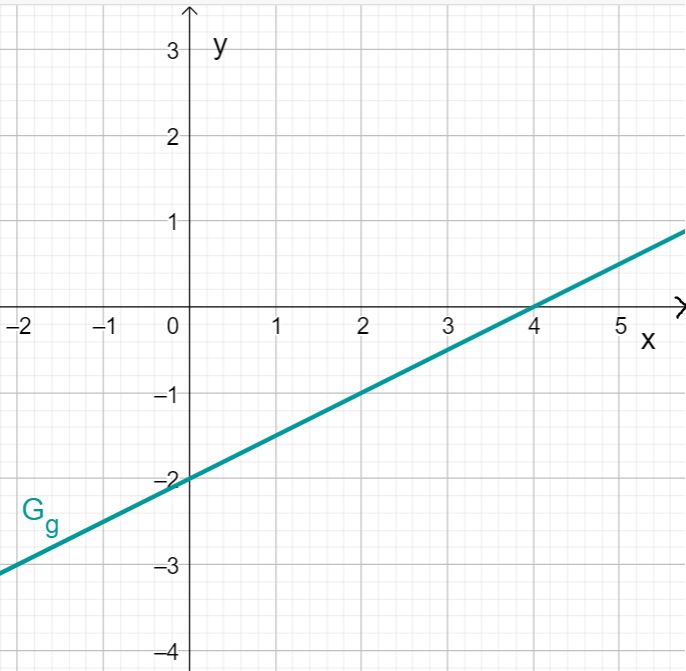
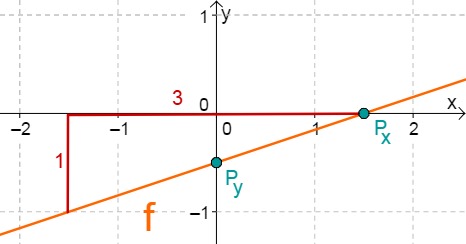
Draw the line
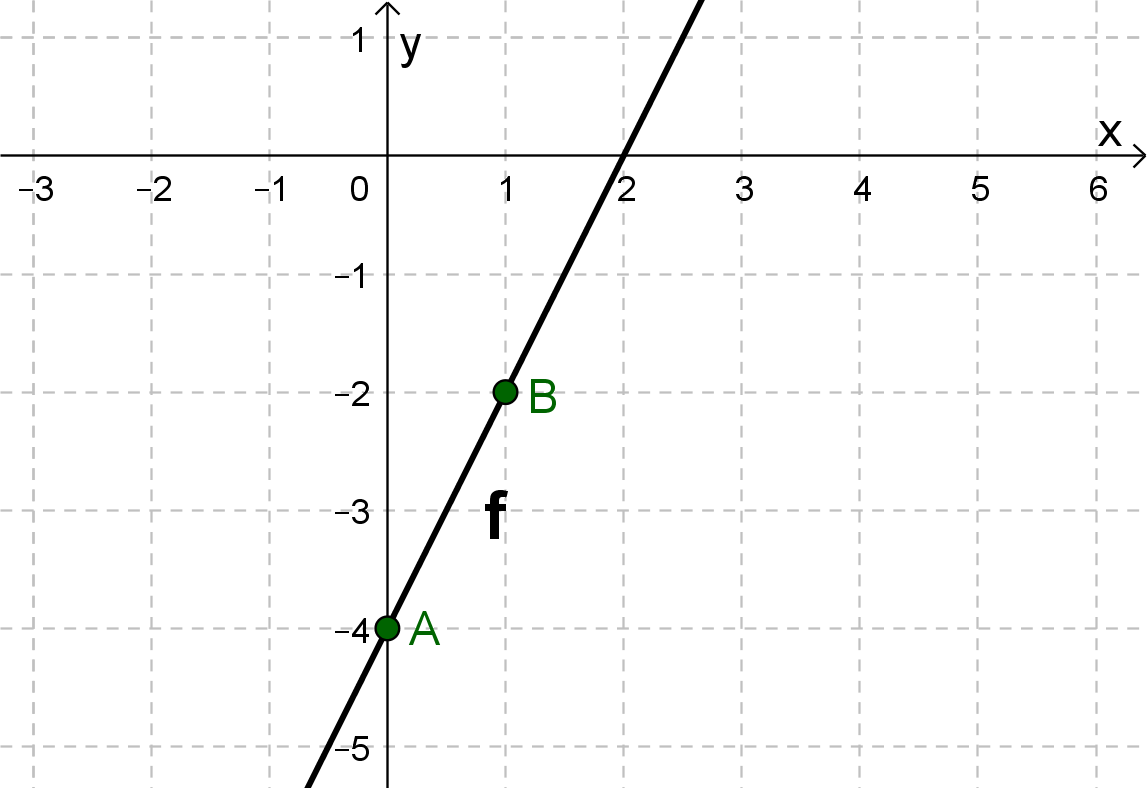
Go from the previously determined point one unit to the right and upwards, since is equal to . Here is a second point of the function.
Then connect the two points to form a straight line.
For this task you need the following basic knowledge: Linear function
Transform the equation
First, we do a little transformation, such that we get the form of a general line equation.
Determine one point
is the within the general line equation, or in other words, the -axis intercept.
Find the slope
Determine the slope of the function
is the within the general line equation, or in other words, the slope.
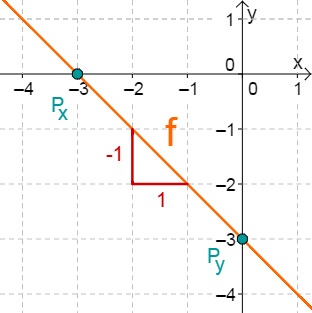
Draw the line
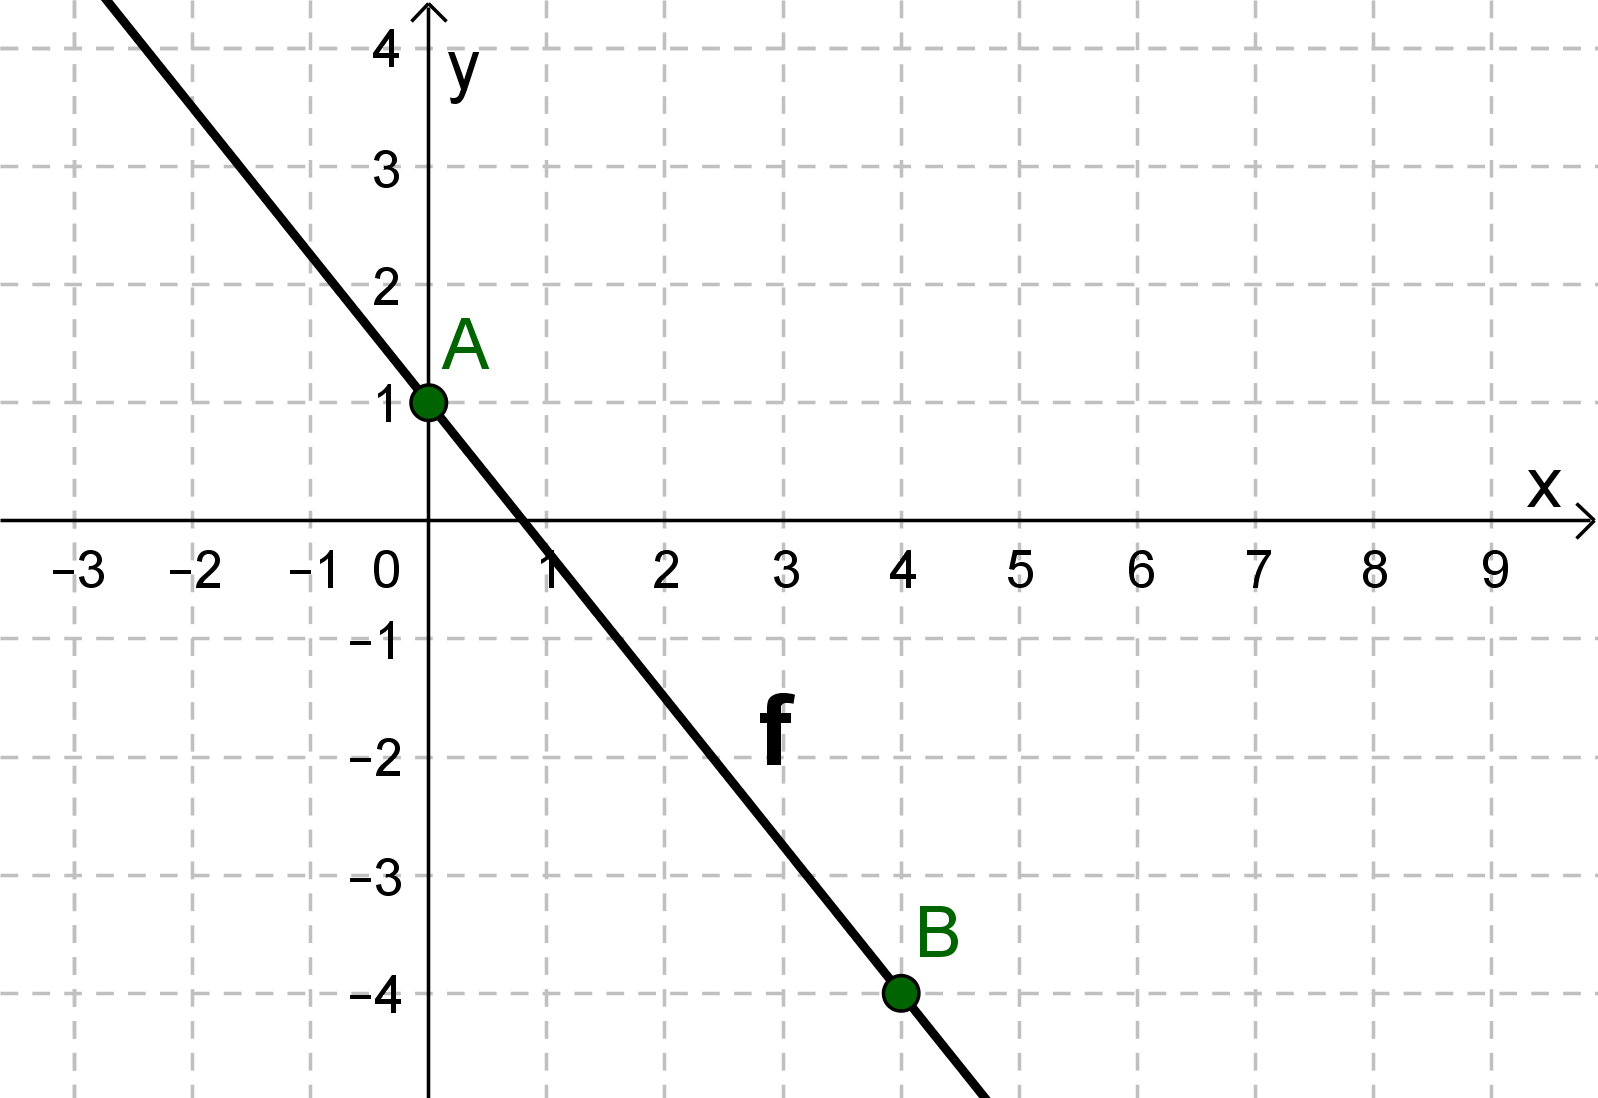
From the previously determined point, go one unit to the right and downwards, since is negative. Here is a second point of the function.
Then connect the two points to form a straight line.
For this task you need the following basic knowledge: Linear function
Determine one point
is the within the general line equation, or in other words, the -axis intercept.
Find the slope
Determine the slope of the function
is the within the general line equation, or in other words, the slope.
Draw the line
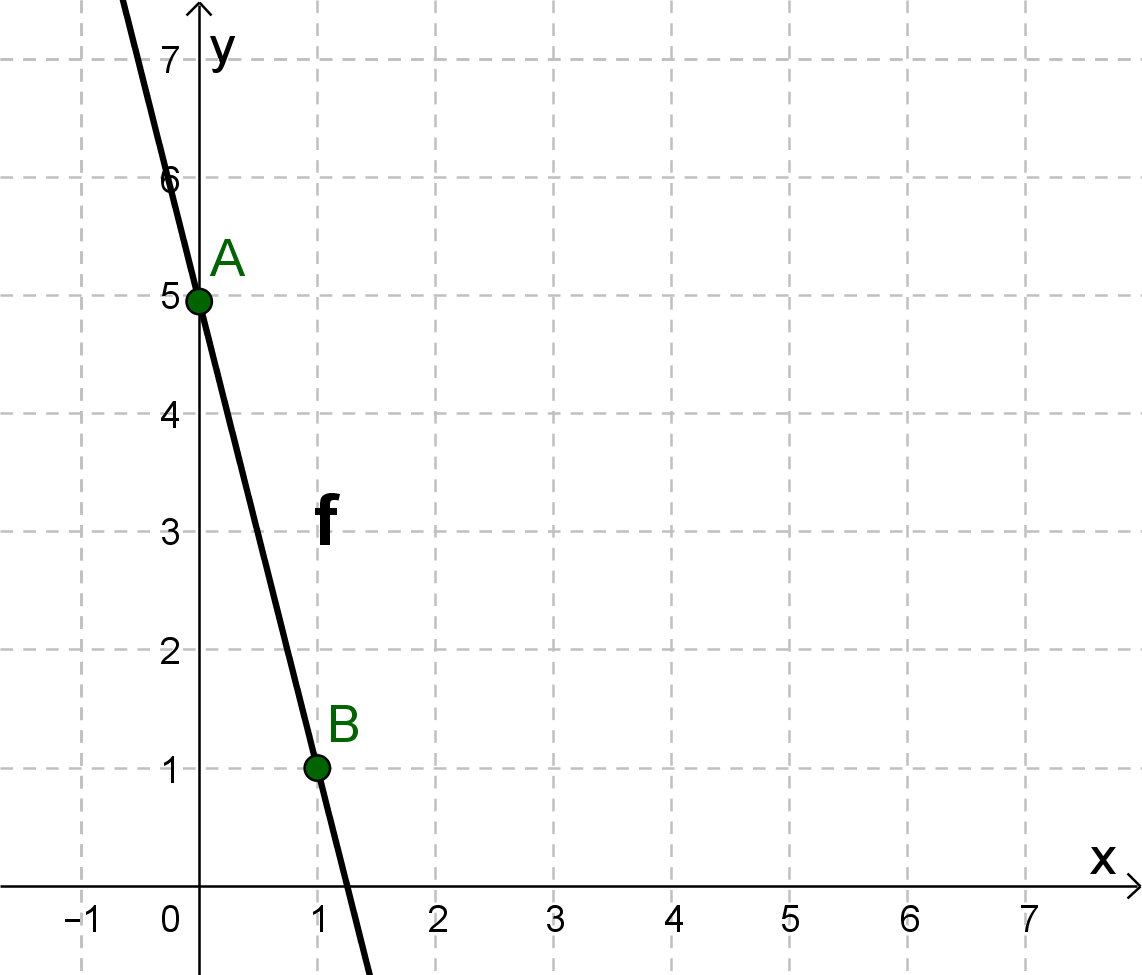
From the previously determined point, go one unit to the right and downwards, since is negative. Here is a second point of the function.
Then connect the two points to form a straight line.
For this task you need the following basic knowledge: Linear function
Determine one point
is the within the general line equation, or in other words, the -axis intercept.
Find the slope
Determine the slope of the function
is the within the general line equation, or in other words, the slope.
Draw the line
From the previously determined point go one unit to the right and upwards, since is positive. Here is a second point of the function.
Then connect the two points to form a straight line.
- 4
Draw the graphs of the following lines with the point of intersection with the -axis and the gradient triangle. Calculate the point of intersection with the -axis and check the result using the graph.
For this task you need the following basic knowledge: Lines in coordinate systems
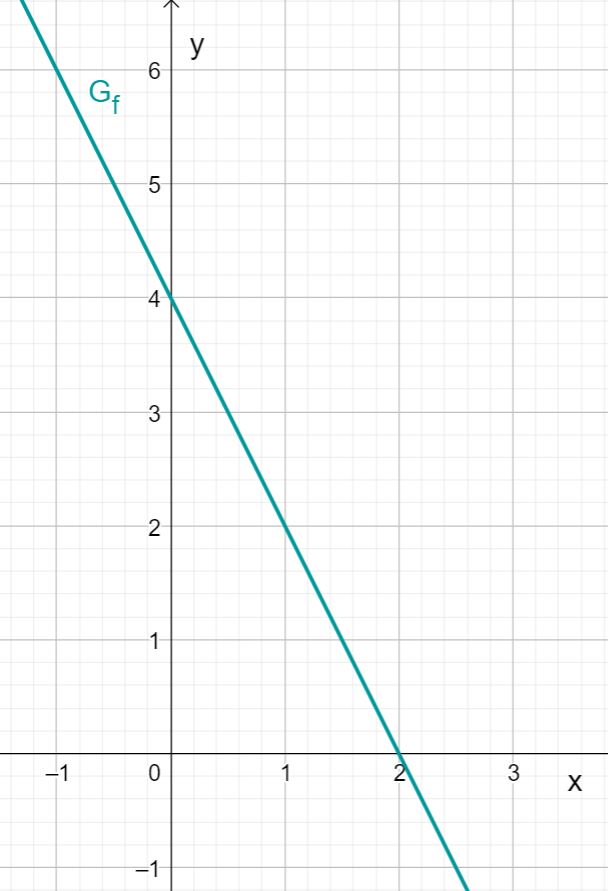
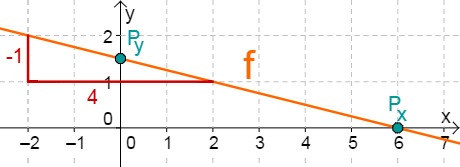
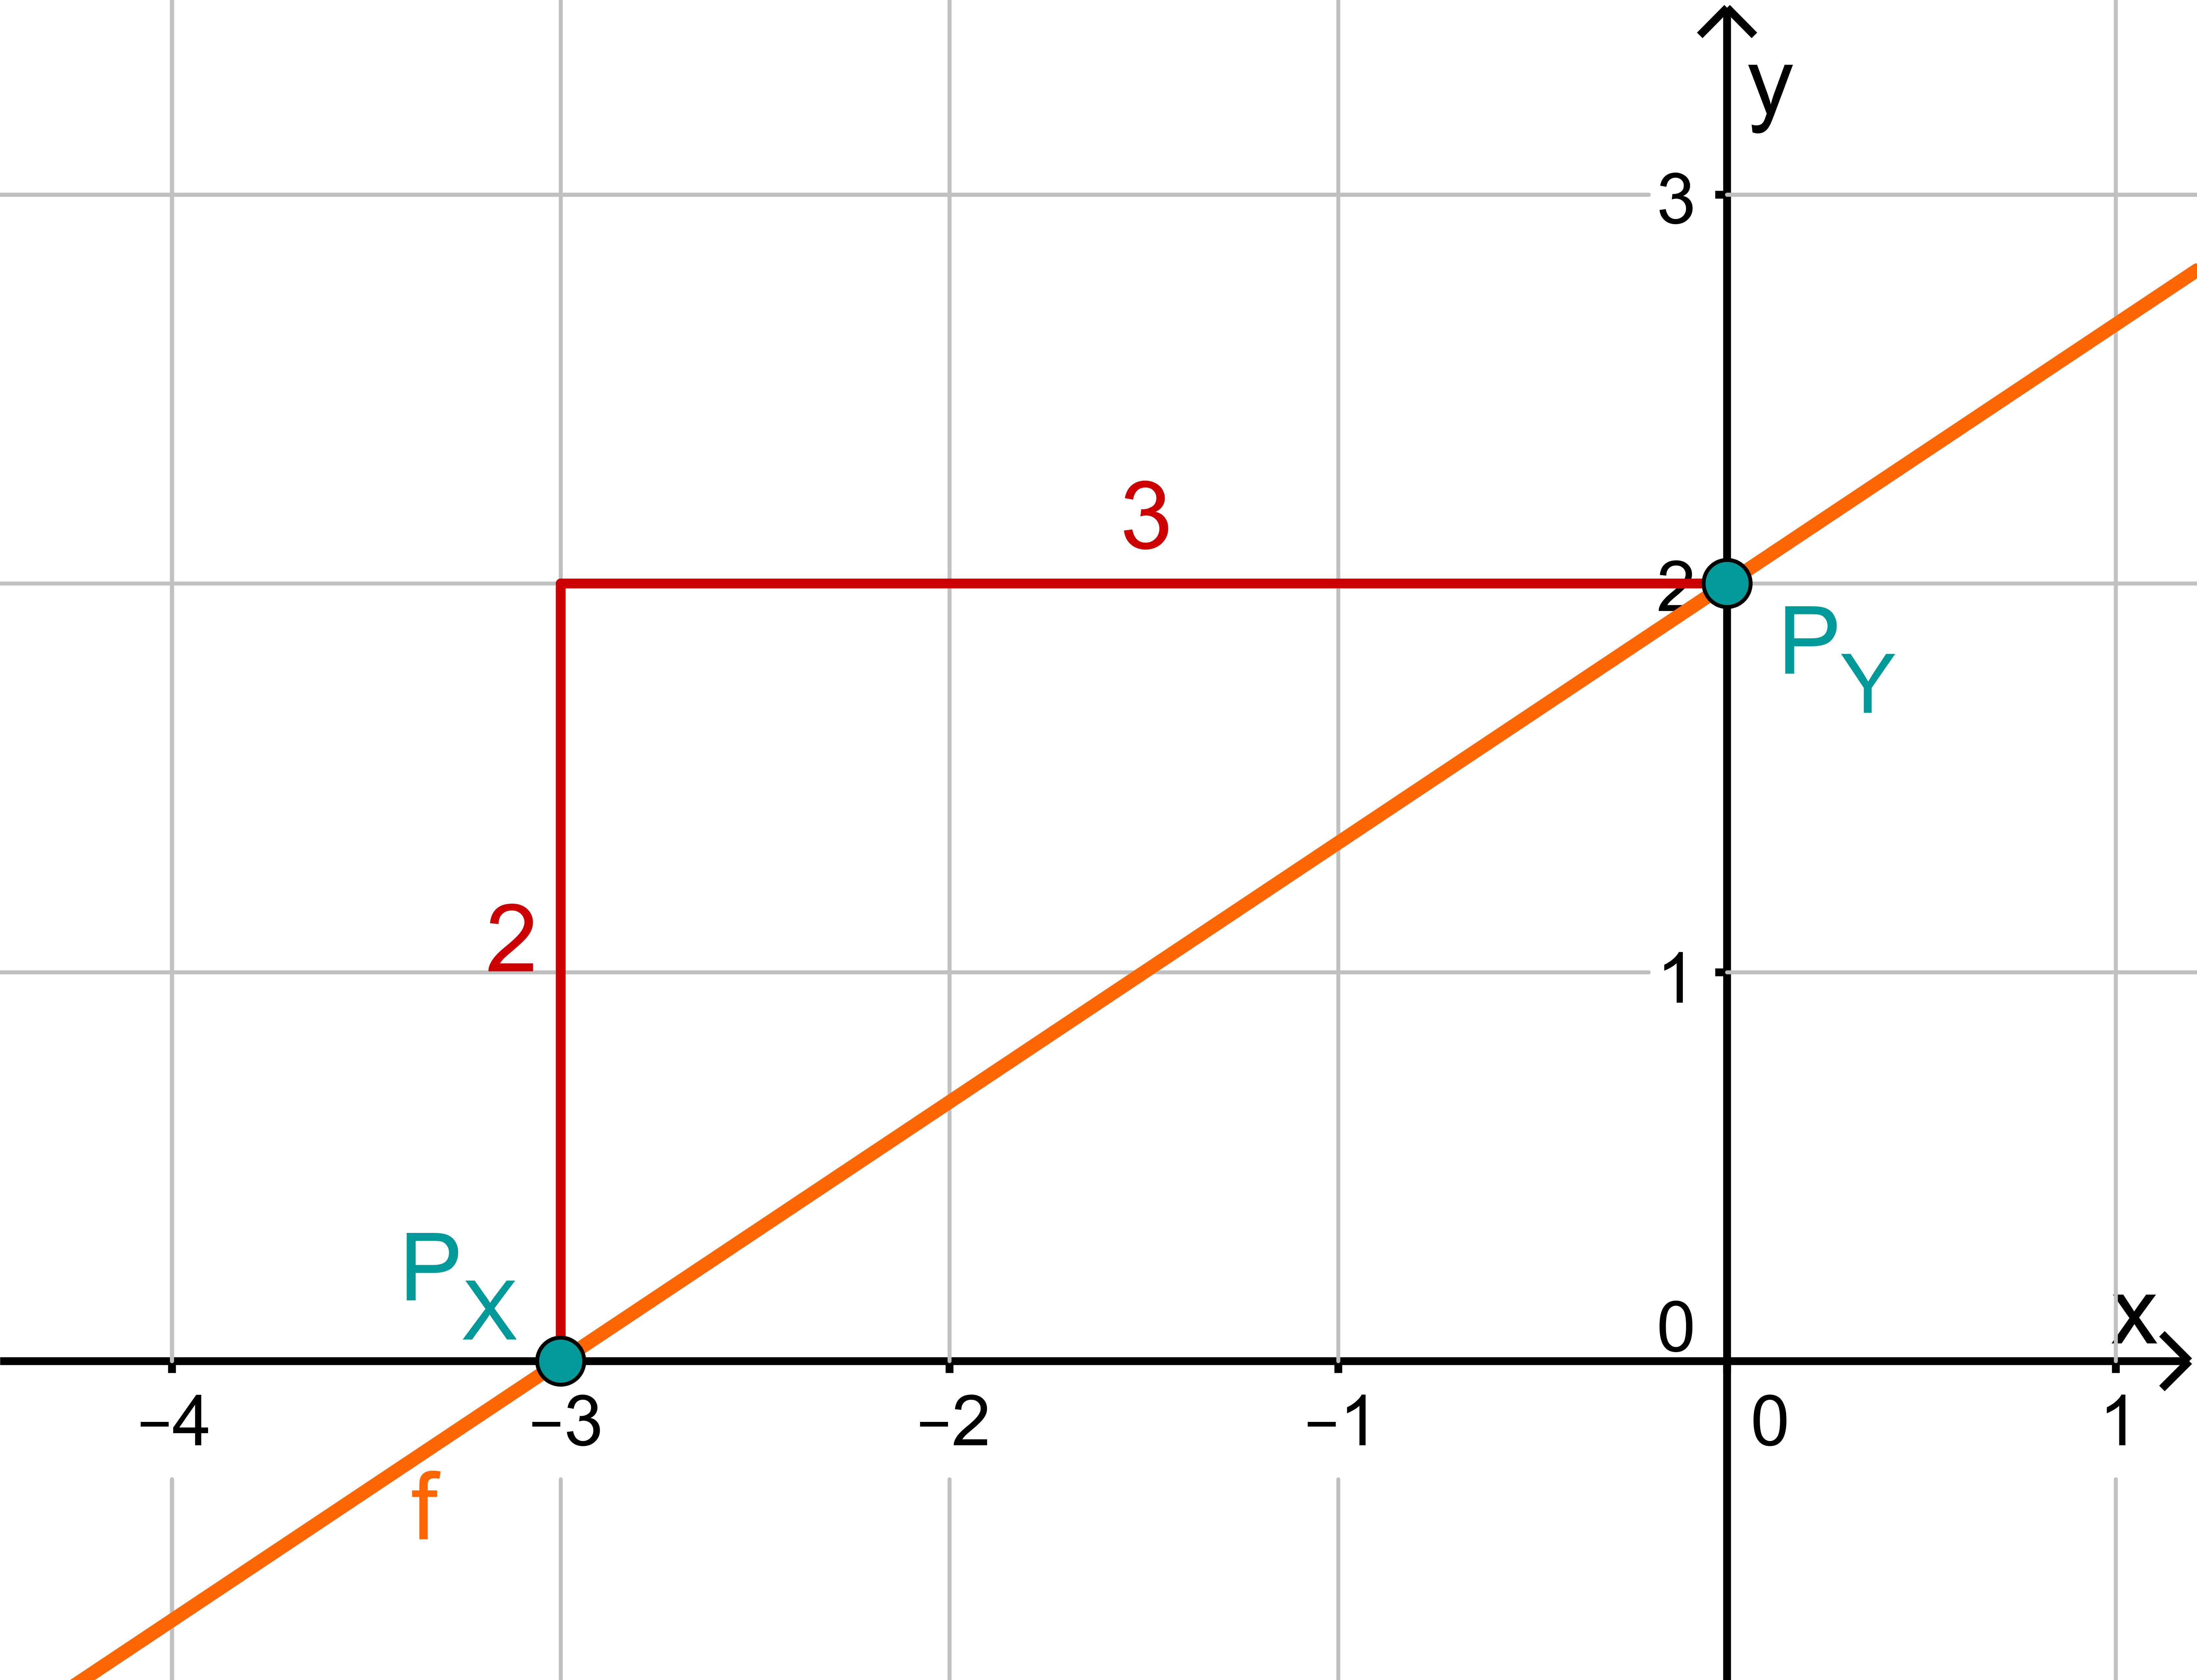
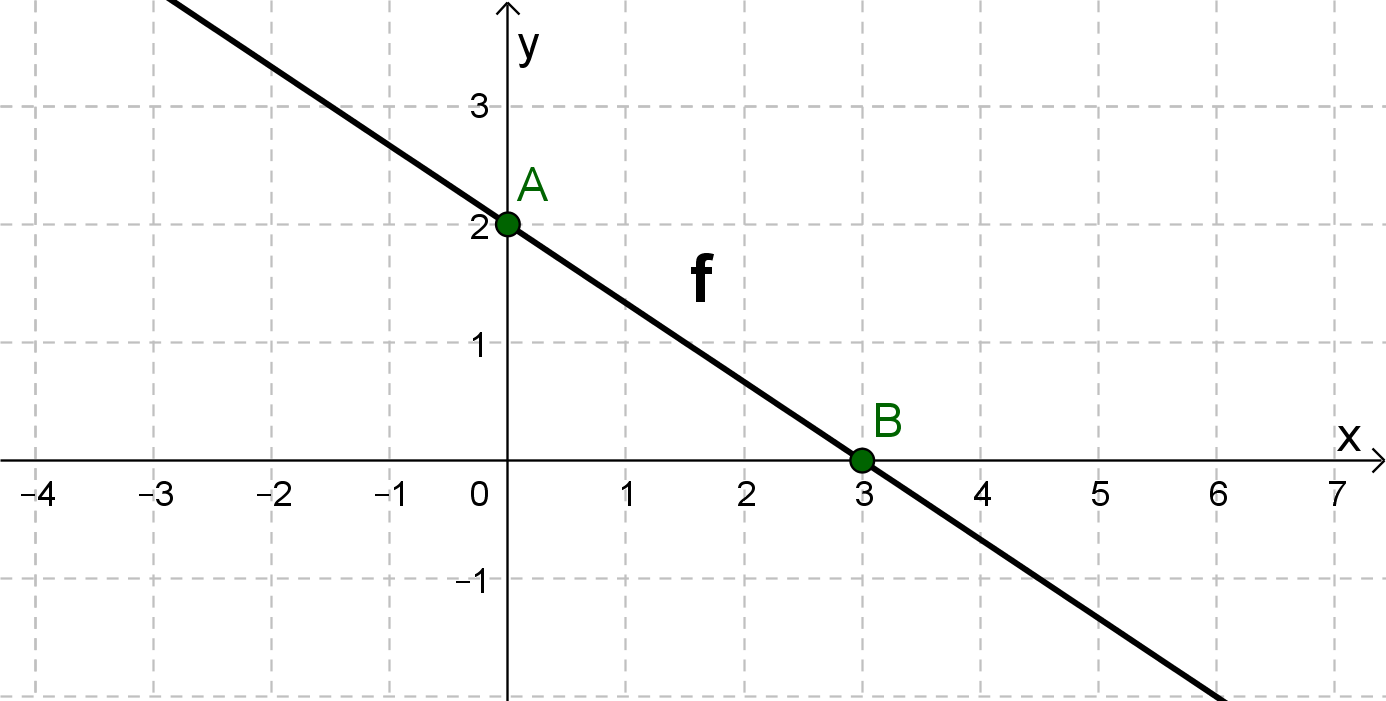
First read off the -axis intercept and the slope from the function equation.
Calculate the point of intersection with the -axis. Set the function term equal to 0.
For this task you need the following basic knowledge: Lines in coordinate systems
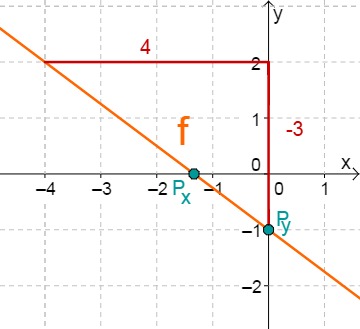
First read off the -axis intercept and the slope from the function equation.
For this task you need the following basic knowledge: Lines in coordinate systems
First read off the -axis intercept and the slope from the function equation.
Calculate the point of intersection with the -axis. Set the function term equal to 0.
For this task you need the following basic knowledge: Lines in coordinate systems
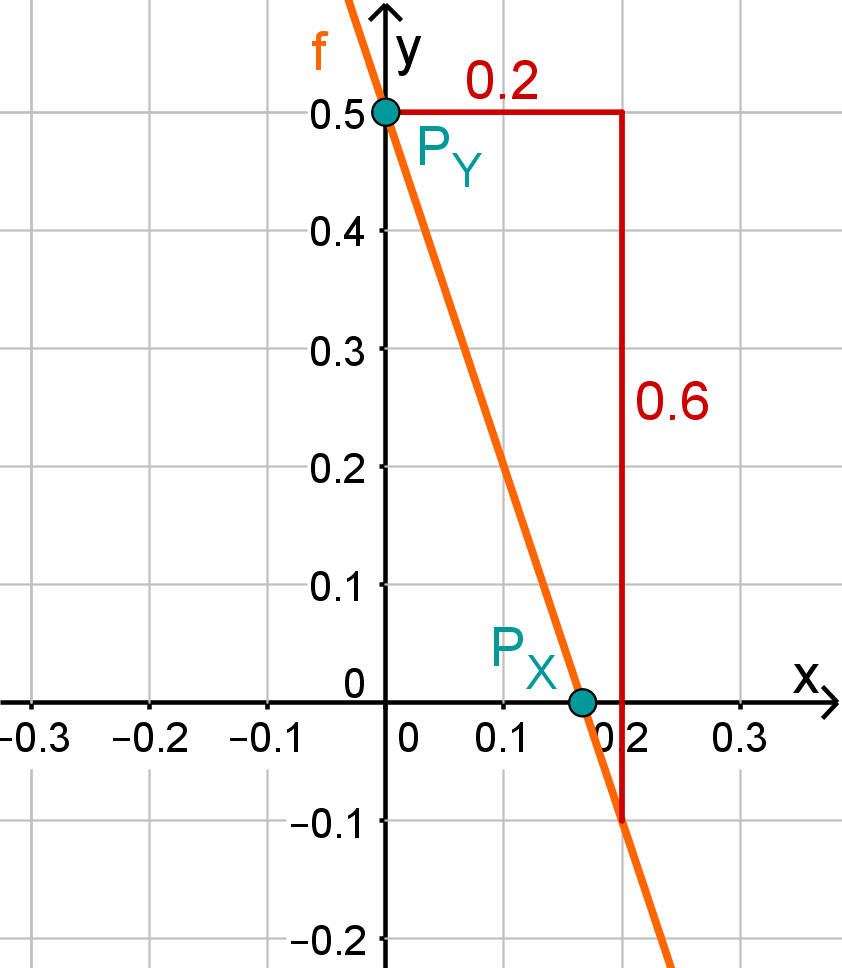
First read off the -axis intercept and the slope from the function equation.
Calculate the point of intersection with the -axis. Set the function term equal to 0..
For this task you need the following basic knowledge: Lines in coordinate systems
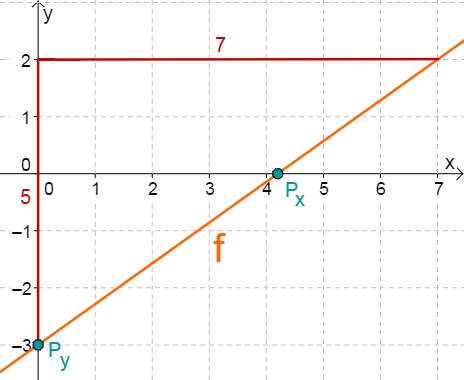
First read off the -axis intercept and the slope from the function equation.
Calculate the point of intersection with the -axis. Set the function term equal to 0.
For this task you need the following basic knowledge: Lines in coordinate systems
First read off the -axis intercept and the slope from the function equation.
Calculate the point of intersection with the -axis. Set the function term equal to 0.
For this task you need the following basic knowledge: Lines in coordinate systems
First read off the -axis intercept and the slope from the function equation.
Calculate the point of intersection with the -axis. Set the function term equal to 0.
For this task you need the following basic knowledge: Lines in coordinate systems
First read off the -axis intercept and the slope from the function equation.
Calculate the point of intersection with the -axis. Set the function term equal to 0.
For this task you need the following basic knowledge: Lines in coordinate systems
First read off the -axis intercept and the slope from the function equation.
Calculate the point of intersection with the -axis. Set the function term equal to 0.
For this task you need the following basic knowledge: Lines in coordinate systems
First read off the -axis intercept and the slope from the function equation.
Calculate the point of intersection with the -axis. Set the function term equal to 0.
- 5
Draw the graphs of each of the following functions in a coordinate system.
For this task you need the following basic knowledge: Lines in coordinate systems
For this task you need the following basic knowledge: Lines in coordinate systems
For this task you need the following basic knowledge: Lines in coordinate systems
For this task you need the following basic knowledge: Lines in coordinate systems
For this task you need the following basic knowledge: Lines in coordinate systems
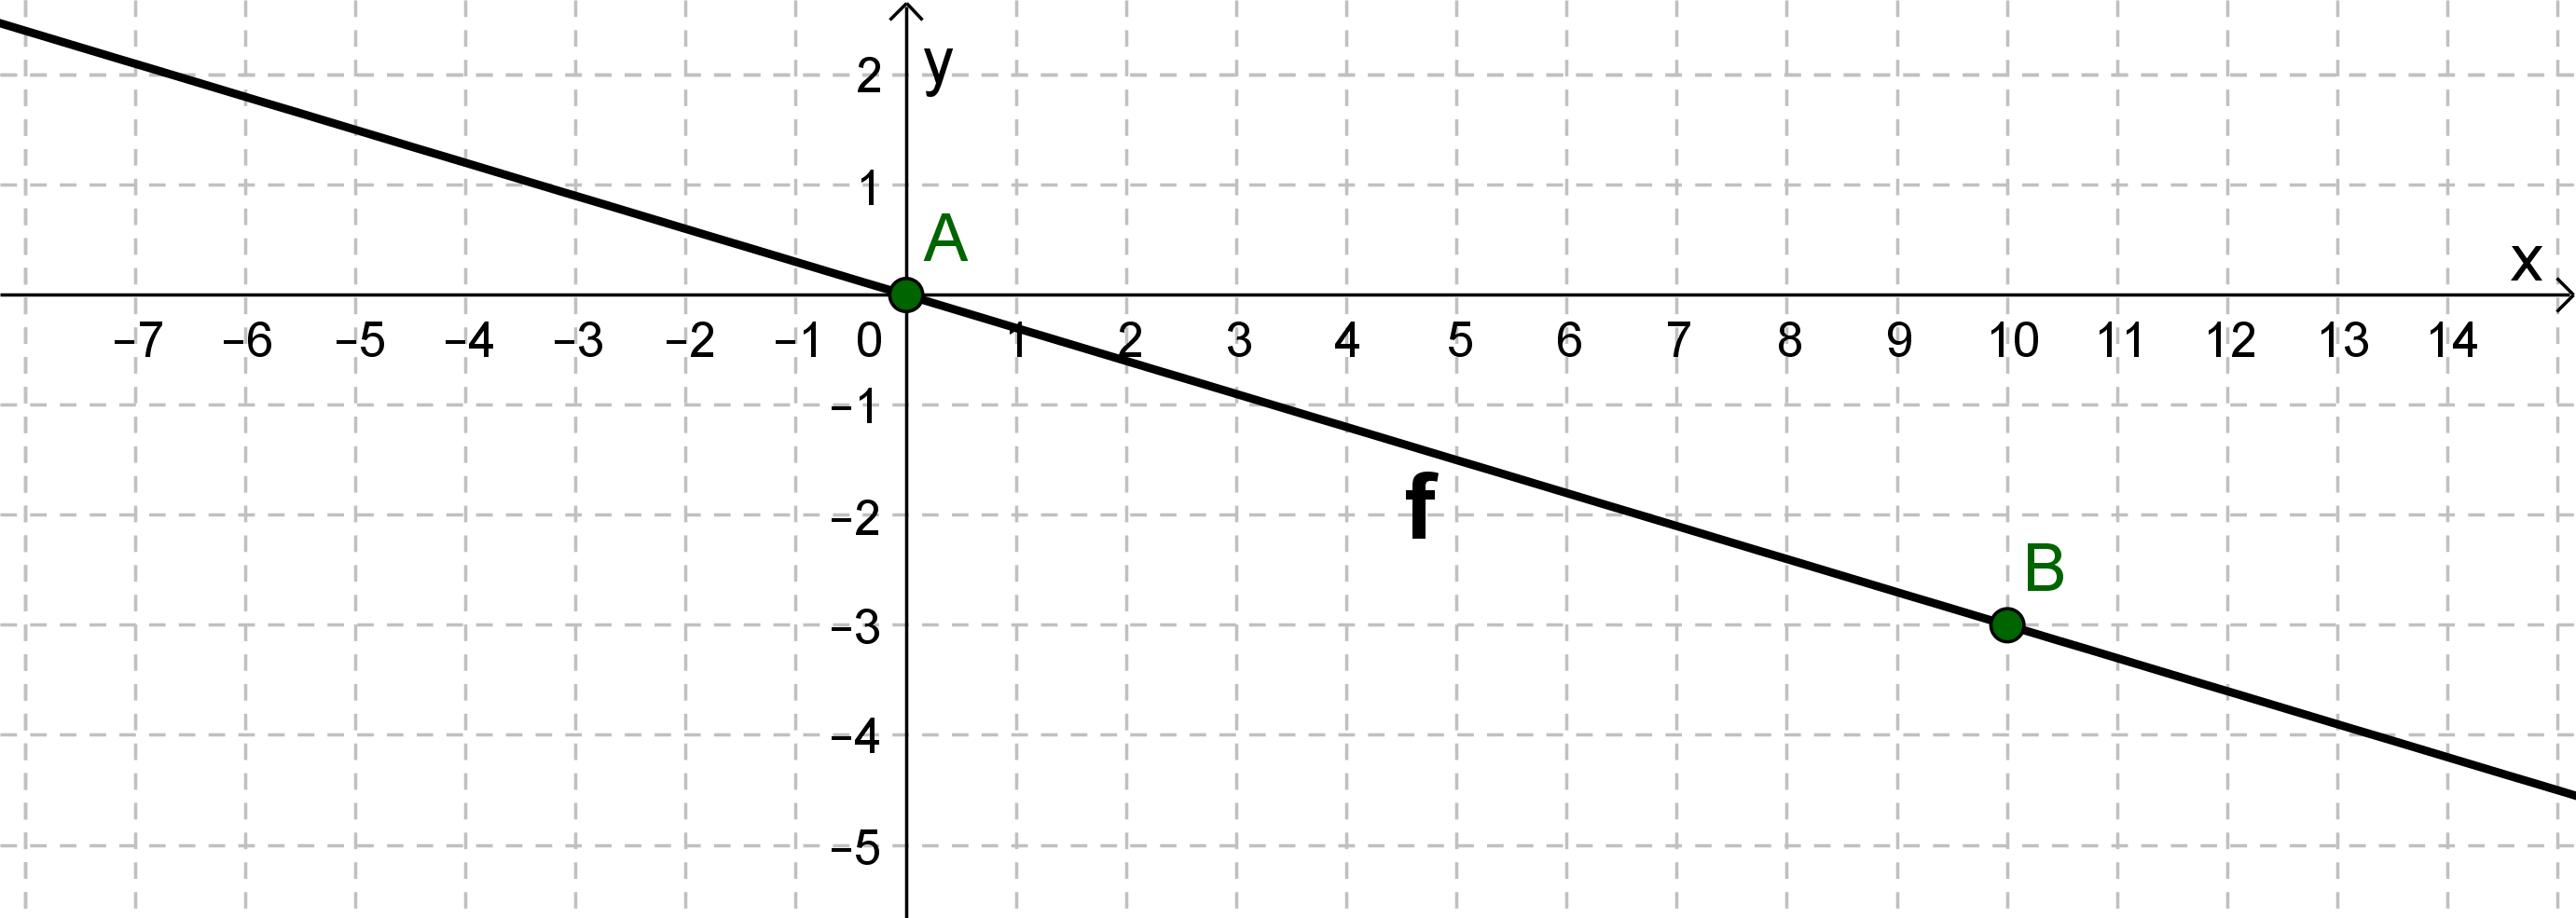
The comparison with the general form of the straight line equation , results in: Intercept t=0 and slope
From the value of the -axis intercept it follows that our line is a line passes through the origin: .
Write the slope as a fraction: . Go 10 to the right and 3 down according to the slope. There you find a second point on the line .
The line is drawn through the two points and .
For this task you need the following basic knowledge: Lines in coordinate systems
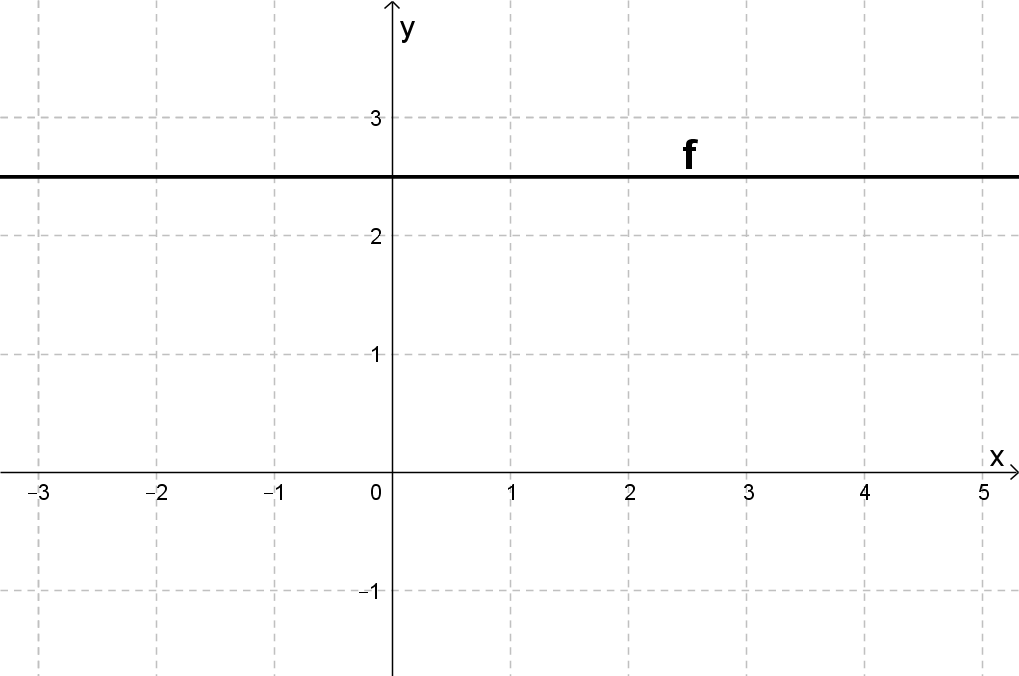
The -value of the straight line is always 2.5. Therefore, the straight line is parallel to the -axis.
- 6
Consider the function with .
Compute a table of values for with where the step length is .
For this task you need the following basic knowledge: Linear function
The table of values for with step length :
x
-3
-2
-1
0
1
2
3
y
-0.9
-0.6
-0.3
0
0.3
0.6
0.9
Plot the points of the function in a coordinate system and draw the graph of the function .
For this task you need the following basic knowledge: Linear function
Points of the function in the coordinate system and graph of the function :

Zu welcher besonderen Art von Geraden gehört der Graph der Funktion ?
For this task you need the following basic knowledge: Linear function
The graph of the function is a line that passes through the origin of the coordinate system.
Check by calculation whether the points and lie on the graph of the function .
For this task you need the following basic knowledge: Linear function
Insert the coordinates of and into the function equation:
Point :
↓ plug in coordinates
↓ false statement
Answer: The point does not lie on the graph of the function .
Point :
↓ plug in coordinates
↓ true statement
Answer: The point lies on the graph of the function .
Additional illustration of the graph with the two points and
(Ths is not required by the problem setting, but just provided for better visualization.)
